For my entire adult life, I can’t recall an initiative to collect data to combat racial discrimination that has not been met with enthusiastic support. But then President Trump announced that colleges would have to submit more of their admissions data to combat racial discrimination, and things got weird.
To understand the context here, recall that a couple of years ago, the Supreme Court took cases about affirmative action in college admissions at Harvard and the University of North Carolina, which tended to privilege black and Hispanic applicants while disadvantaging white and, especially, Asian applicants. Many colleges argued that affirmative action was necessary to maintain racially diverse student bodies. The Supreme Court ruled that such racial discrimination was illegal in 2023.
In the first college admissions cycle following the decision, many schools saw an increase in the number of Asian students and a decrease in the number of black students admitted. But the racial composition remained unchanged at other colleges, and some, such as Yale and Duke, reported an increase in the share of black, Hispanic, or Indigenous enrollment. There could be perfectly legal reasons for these differences among colleges. But it is also possible that some colleges are still engaging in illegal racial discrimination. Enter Trump’s order to report more admissions data.
In contrast to every other data collection effort to combat racism, this initiative is being met with resistance. A good article by Jill Barshay of the Hechinger Report collects many of the more persuasive arguments made by well-informed people. There are concerns about capacity, disaggregation, implementation, and more. The overall takeaway is that “data experts and higher education scholars warn that any new admissions data is likely to be inaccurate, impossible to interpret, and ultimately misused by policymakers.”
Most of these concerns are legitimate, but many can also be addressed with sufficient effort. Moreover, these types of arguments rarely prevented previous data collection efforts aimed at fighting racial discrimination, not to mention that some who made these types of arguments in the past were unjustly labeled closet racists.
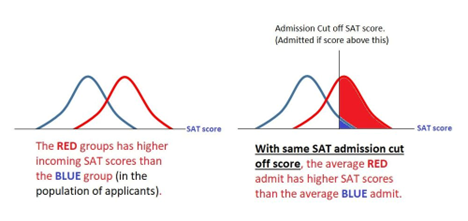
But probably the most fascinating objection to collecting admissions data was that reporting institutional averages, such as average SAT scores of applicants by race, can be misleading. A chart by Kirabo Jackson, reproduced below, nicely illustrates this point. In the graphic, a colorblind policy was followed, with everyone with a score higher than the cutoff being admitted. But differences between the distribution of the red and blue groups—meaning the red curve is to the right of the blue curve—mean that the red group will have a higher average reported score than the blue group, even though both were subject to the same colorblind score cutoff.
A few points about this.
One, this is a true and valuable point. The main takeaway here is that differences in average or median scores of accepted applicants are not proof of discrimination but are a red flag warranting a closer look using student-level data.
Two, others have been vilified for making basically the same point. Charles Murray and Richard J. Herrnstein’s The Bell Curve used the exact same curves as Jackson and discussed differences in the distribution among races. Could Murray have saved himself decades of abuse by using red and blue instead of real racial categories? (Herrnstein died before the book was published). Probably not. The famous quote that “All truth passes through three stages: First, it is ridiculed; second, it is violently opposed; and third, it is accepted as self-evident”—typically attributed to philosopher Arthur Schopenhauer but this is probably a misattribution—implies that Murray was simply too early, publishing his book in the “violent opposition” period rather than the “self-evident” period.
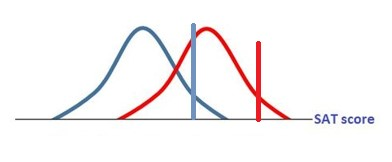
Three, that’s not the only way for a difference in average scores by group to emerge. Another way is to have group-specific cutoffs, where the blue and red groups have different cutoffs. An example of this is shown below, where the cutoffs are designed to ensure equal representation among red and blue.
There is evidence that colleges used different cutoffs for different groups, noting that the cutoffs were intentionally fuzzy to account for factors beyond just test scores. For example, at Harvard, black students with scores in the top 10 percent of all students had a 56 percent chance of being admitted, while Asian students with the same scores had only a 13 percent chance of being admitted. In fact, Asians in the top 10 percent had about the same chance of being admitted as blacks in the 60-70 percent range.
This practice, holding people to different standards based on their race, is the crux of the matter. To many folks, it is proof of racial discrimination. To avoid reaching that conclusion, you’d need to argue that tests like the SAT are racist, or that systemic racism rather than underlying intellectual ability is driving the different distributions, which is exactly what many woke scholars and activists—implausibly—argue.
A more likely explanation for differences in test scores among races is that differences in school quality effect test scores, such that even if underlying ability is the same, if the blue group attends worse K-12 schools than the red group, this will result in differences in test scores. To the extent that differences are artificial due to differences in school quality, this provides yet another reason to try to improve school quality.
The Trump administration is certainly doing lots of new things, including in higher education. But collecting data to fight discrimination isn’t one of them—we’ve been doing that for decades. What is new is the opposition to fighting racial discrimination.
Follow Andrew Gillen on X.
Image: “UNC South Building” by Yeungb on Wikimedia Commons