I taught ACT classes to high school students for over a decade. To keep abreast of changes in the test, I took more than a dozen myself. So, I know the ACT better than most. I’ve also published several analyses of ACT results—here, here, and here—all of which convinced me of two facts: The test is a fair, unbiased measure of what students have—or should have—learned in high school, and that not all groups of students are doing poorly. The most recent 2023 results are no exception.
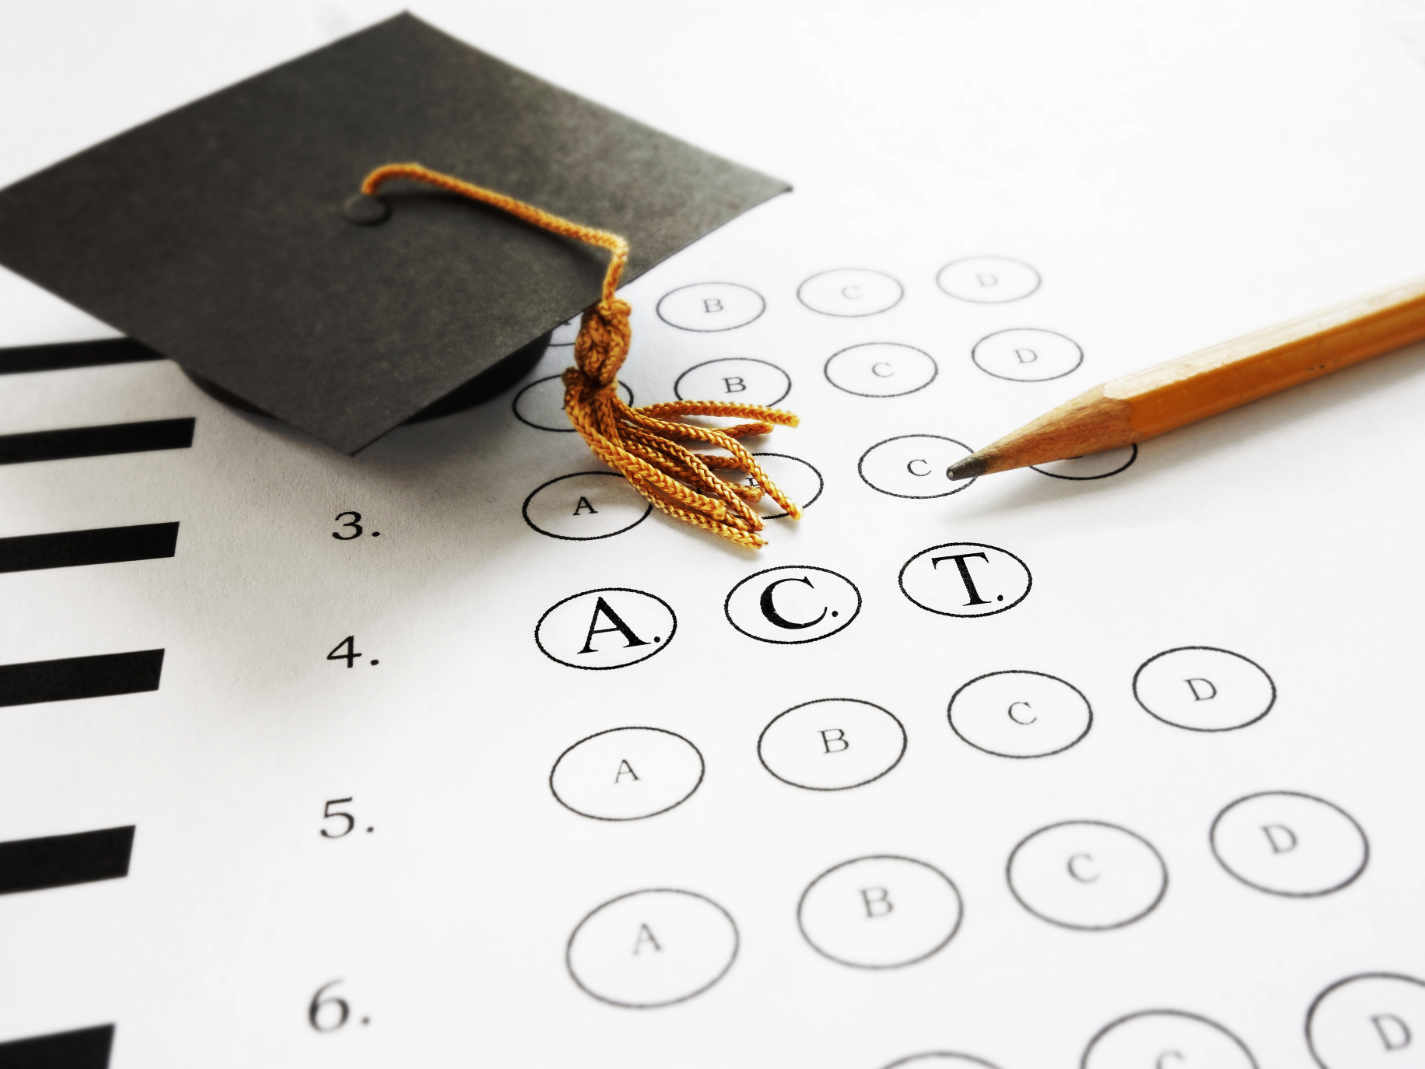
The ACT has four multiple-choice subject sections: English, math, reading, and science. The number of correct answers on each section is converted to a scaled score from 1–36 and averaged into a student’s composite score. Thirty-six is a perfect score.
In 2005, the ACT established four, empirically-based “College Readiness Benchmark Scores” which were updated in 2013 to 18 for English, 22 for math and reading, and 23 for science. These are the minimum scores that predict a 50 percent chance of earning B, or a 75 percent chance of earning C in a corresponding credit-bearing college course.
To understand trends in the ACT, you have to look beyond year-to-year fluctuations—the ACT suggests 5-to-10-year intervals. So, although I’ve done finer grained analyses elsewhere, here I’ve compared the most recent—2023—scores to those from one and two decades prior—2013 and 2003.
In 2023, approximately 1.4 million students took the ACT, intermediate between the two earlier cohorts—1.2m and 1.8m, respectively. In 2003 and 2013, the average composite scores were virtually identical—20.8 and 20.9— and the subject scores differed by less than 0.3 points. However, in 2023, the average composite score was just 19.5, and subject test scores dropped by as much as nine percent. In addition, there was a 21 percent decline—from the 2003/2013 highs—in the number of students meeting any of the College Readiness Benchmarks. Although the latest declines caused a lot of handwringing, and wrongheaded claims about testing biases, there is a more nuanced—and more positive—story in the data.
First, it’s clear that a key reason for the 2023 decline is that students took much less rigorous course loads than in previous decades. In 2023, only 41 percent of students had taken what the ACT calls “Core or More,” four or more years of English and three or more years each of math, social studies, and natural science. In 2003 and 2013, 57 percent and 74 percent did so. The effects of this change are clear: Over all three cohorts, students who took Core or More scored an average of 11-19 percent higher on subject tests, and 14 percent higher overall than did students who took a less rigorous mix of courses. Note that these differences exceed the composite score decline over the same decades.
More importantly, however, Core or More was most beneficial for students who, historically, have fared poorly on standardized tests. For instance, in 2023, the percentage of students self-identifying as Black/African American, American Indian/Alaska Native, Native Hawaiian/Other Pacific Islander who met at least three of the ACT’s College Readiness Benchmark scores was 100-150 percent higher for those who took Core or More than for those who did not. Similarly, 32-72 percent more students in the ACT’s other racial/ethnic categories met at least three of the four College Readiness Benchmarks if they took Core or More. In other words, rigorous coursework dramatically increases test performance for all groups of students, irrespective of race or ethnicity.
If one considers only overall average composite scores—as most do—the ranking of the ACT’s ethnic/racial categories has remained unchanged for decades. For instance, in the three cohorts considered here, students identifying as Asian—or Asian-American/Pacific Islander in 2003—White, and Two or More Races—in 2013 and 2023—scored as much as 24 percent higher than their cohort’s overall average. In contrast, those identifying as Hispanic/Latino, Native Hawaiian/other Pacific Islander, American Indian/Alaska Native, and Black/African-American scored as much as 18 percent below the average. These aggregated data are what’s used—erroneously—to claim that the ACT is racially biased.
However, as I have argued elsewhere, grouping scores by these arbitrary and anachronistic racial/ethnic categories not only perpetuates misleading stereotypes, it hides the key predictor of ACT performance: “Student Post Secondary Aspirations.” The ACT reports student aspirations as their self-reported plans to pursue a Graduate, Professional Level, Bachelor’s, Two-Year College, or Vocational-Technical degree after high school.
In 2003, the ACT reported only overall composite scores in terms of aspirations. Nonetheless, the data were amazing. Scores were 34 percent higher for students aspiring to a Graduate Degree versus those intending to pursue Voc-Tech, and the intermediate scores declined progressively between the two extremes. The same pattern repeated in 2013 and 2023. More importantly, however, the composite scores of students in the top aspirational categories—Grad. Study, Prof. Level Deg., Bachelor’s Deg.—actually increased each decade by as much as eight percent.
In 2006, the ACT began reporting scores in terms of both aspirations and ethnic/racial categories. Again, the results were remarkable. In 2013 and 2023, students in the four historically lowest performing groups—Hawaiian/Pacific Islander, Hispanic, American Indian/Alaska Native, Black/African American—who aspired to a Graduate or Professional degree actually outscored students in the historically highest performing groups—Asian, White, Two or More Races—who aspired to a Two-Year College or Voc-Tech degree by as much as 42 percent. In other words, aspirations were a far better predictor of student performance than were the ACT’s outmoded racial/ethnic categories.
So, despite declines in overall average performance from 2003 to 2023, students who took more rigorous coursework and had higher postgraduate aspirations not only improved, but they also outperformed other students—irrespective of their race or ethnicity. In fact, in 2023, students who planned to pursue Graduate or Professional degrees outperformed their cohort’s average by as much as 41 percent, again, regardless of race or ethnicity.
So, again in 2023, hard-working, ambitious Black, Hispanic, Pacific Islander, and native American students outscored Asian and White students with more modest aspirations. Why doesn’t anyone notice?
Photo by zimmytws — Adobe Stock — Asset ID#: 93916860
Unfortunately, the author has fallen into the trap (usually associated with statistics) that gives an incomplete—and possibly misleading—picture.
The author states:
“In 2013 and 2023, students in the four historically lowest performing groups—Hawaiian/Pacific Islander, Hispanic, American Indian/Alaska Native, Black/African American—who aspired to a Graduate or Professional degree actually outscored students in the historically highest performing groups—Asian, White, Two or More Races—who aspired to a Two-Year College or Voc-Tech degree by as much as 42 percent.”
First of all, 42% may sound impressive, but how many students are we talking about? Suppose there was only one brilliant American Indian student who aspired to a professional degree. That would be sufficient to support the 42 percent claim.
Second, what is that claim supposed to prove? Asian or White students who go to a Voc-Tech school to study plumbing don’t really care about the ACT. Why not? Because they want to be a plumber and the Voc-Tech school doesn’t require applicants to take it. Hence, they don’t prepare for the ACT and don’t try very hard if asked to take it.
Third, is the 42% higher score due to brilliant black students or due to Voc-Tech students not caring about the test and therefore doing poorly?
I appreciate the point the author is trying to make. I just don’t think the case was made.
The author left out the most direct evidence that the ACT is not racially biased. ACT scores actually slightly OVERPREDICT how well black and Hispanic students will do in college (as measured by college grade point average). If the ACT were actually biased against members of these groups, then these students would perform better in college than predicted by their ACT scores. The same is true of the SAT; it also slightly overpredicts how well black and Hispanic students will do in college. The opposite would be expected if these tests were biased.
As he left office, President Eisenhower warned about the “military industrial complex.”
Today we have the “social justice & diversity complex.”
The payroll of all public universities is public information — somewhere in your library will be a budget book showing everyone’s annual salary. Sometime wade through it with a calculator and add up all the salaries of all the people whose jobs somehow relate to racism or outreach or support services — and then think about the consequences of what would happen if next fall a whole bunch of really qualified Black & Hispanic freshman were to show up on campus and all these people were no longer needed.
If all these people with six figure salaries no longer had jobs — nor prospects elsewhere….
It would be just like what happened to Massachusetts in the late ’80s/early ’90s when all of the high-tech DoD money dried up and suddenly the bottom suddenly dropped out. Or when the Apollo Program ended two decades earlier.
There is a very real incentive for not wanting racism to end — a very human one.
An engineer could go teach high school physics — whatever would these people be able to do?
“So, again in 2023, hard-working, ambitious Black, Hispanic, Pacific Islander, and native American students outscored Asian and White students with more modest aspirations. Why doesn’t anyone notice?
There are two very vested interest groups that don’t want anyone noticing this, and people who would lose a lot of money if anyone ever did.
First is the diversity industry that controls much of higher education. How would they fare if it became known that various variants of “racism” really weren’t impeding hard working and ambitious members of the aforementioned minority groups?
How would they fare if society ever realized that the solution to having more qualified racial minorities in higher education is to clean up the morass of K-12? And what would happen to the support agencies if the students they were supporting didn’t need their support anymore?
But the bigger issue is in K-12. It’s hard work to teach boys (of any race) to read, it’s even harder with a mostly female teaching cadre who don’t even understand what interests boys. Likewise it’s really hard to teach Grammar — there are a lot of things you know are wrong but it’s not always so easy to remember the exact rule why they are wrong. It’s so much easier to let things slide…
Likewise with chronic truancy, generally defined as an absence rate in excess of 10% or 18 days of the standard 180 day K-12 school year. You can’t learn if you aren’t there, but the truant students are also often discipline problems, and hence they really aren’t missed that much. And I’m not even getting into the breakdown of the family unit or the consequences of a jaw-dropping 76% Black illegitimacy rate.
A lot of people in K-12 would have an awful lot to answer for if it could be objectively shown that they were denying quality educations to students of color — which they actually are doing through their soft bigotry of low expectations.
And hence they must — absolutely must claim that the SAT, ACT, and other objective assessments are actually “racist” because the only other alternative is to admit that they are racists — and that they are not going to do.
We’ll never see it, but I’d love to see the relationship between SAT/ACT scores and school attendance. I strongly suspect that students of color who actually showed up to school consistently over the past 12 years would do considerably better than white students who didn’t. But we can’t say that — we’re not even supposed to use the word “truancy” anymore…
No, Professor Prete, people do notice this — and that’s why they attack the test itself with such vitriol. Here in Massachusetts, it’s why the teacher’s unions are again attempting to eliminate the much-watered-down MCAS assessment — or at least prevent it from ever being used as a graduation requirement. Scream that a test is racist often enough and no one will realize that it’s actually an accurate assessment of the teaching that you aren’t doing, and the soft bigotry of your own low expectations.
Thank you for your vigorous and thought-provoking reply. Fundamentally, we share the same perspective. And, you are correct. Some people must notice. My final sentence was intended to be facetious… I was alluding to the fact that I’ve not seen the mainstream press ever bring up the point that I’ve written about here and a number of times prior. I think we would all benefit if we recognized that hard work, ambition, and good mentorship go a long way in helping young people succeed irrespective of their immutable characteristics. Thank you again, Frederick