
The financial return to education is fiendishly hard to quantify for a host of legitimate reasons, including limited data availability and the need to account for unobservable counterfactuals. But it is also difficult because of cloudy thinking such as misinterpretations, survivorship bias, and faulty assumptions.
The best example of misinterpretation concerns the decades-long run of the workhorse model—the Mincer regression. A Mincer regression determines the correlation between an additional year of schooling and the change in earnings, often “controlling” for other variables. A typical result from a Mincer regression is that each additional year of schooling is correlated with an increase in earnings of say eight percent.
While probably the best that could be done with the data and methodologies available decades ago, Mincer regressions do suffer from severe flaws as pointed out by many, including James J. Heckman, Lance J. Lochner & Petra E. Todd and David Card. Among the most problematic are
- Exogenous schooling: The models essentially assume that the number of years of schooling each individual receives is randomly determined rather than the result of deliberate choices.
- Experience: The models either don’t give work experience any credit for changes in earnings or use very crude proxies for experience, meaning that in practice, much of the earnings of a 60-year-old manager are attributed to their college education when they were 20.
- Ability and selection bias: Individuals with higher intelligence—at least the types of intelligence valued by schools—tend to acquire more years of schooling, but they would also tend to earn more even if they didn’t attend college.
- Ignores the sheepskin effect: There is considerable evidence for what’s called the sheepskin effect, meaning that it’s the degree, not the years of schooling that matter. In other words, a student that drops out after three years doesn’t get 75 percent of the benefit of someone who graduates.
- Expectations: Expectations play a vital role in the educational choices made by students, yet the models don’t incorporate a role for expectations.
Moreover, many people misinterpreted the results from Mincer regressions. They were often incorrectly reported as finding that college has an 8 percent return on investment. This was wrong not only because these types of regressions typically establish correlation, not causation, but even assuming causality, it still isn’t a valid proxy for return on investment because it ignores direct and indirect costs of college, taxes, and length of working life.
Survivorship bias is also common. If you’re analyzing a set of companies over time, the ones that fail and go bankrupt drop out of the dataset, meaning that rather than analyzing how businesses changed over time, you are looking at how surviving businesses changed over time because those are the only ones you’ll have data for.
In the returns on education literature, this bias often takes the form of ignoring dropouts. For example, nearly a decade ago, some otherwise solid Brookings Institution scholars put out a report claiming a more than 15 percent return to college. As I pointed out back then, they failed to account for the fact that not everyone who enrolls in college graduates. Thus, their 15 percent return was akin to calculating the return on your 401k if you ignored any stocks or bonds that fell in value. Their estimate was framed as the return to enrolling in college but by ignoring those that dropped out, it was actually an estimate of the return to graduating from college.
There are also faulty assumptions. Consider the response to a new paper by Gregory Clark and Christian Alexander Abildgaard Nielsen. Many fields have begun to take the problem of publication bias—where only certain findings are publishable—seriously. Clark and Neilsen “find clear evidence of very significant publication biases… there is strong evidence that studies with returns estimated at less than 0 were not being published.”
Their key finding is evident in Figure 7, reproduced below. The distribution of estimates of the return to education among studies should be normally distributed like the blue curve in the figure, but Clark and Neilsen find that they aren’t. In particular, almost all estimates of negative returns are missing. This is strong evidence that the literature is suffering from publication bias.
Figure 7: Relative Frequency of Estimated Rates of Return Fitted to Normal Distribution
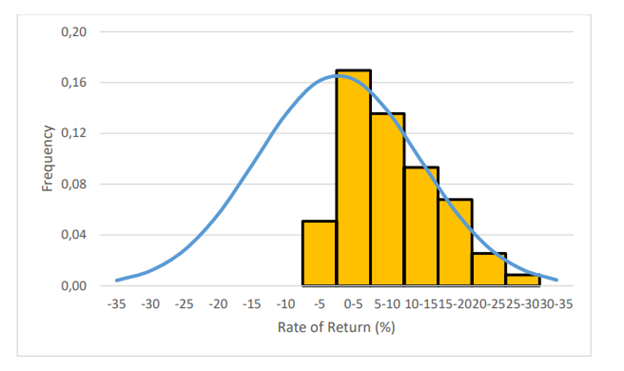
EHES Working Paper — European Historical Economics Society
When Clark and Neilson correct, “for the omission of returns less than 0 implies an overall causal return to education of very close to 0%.”
But Noah Smith and Rachel Meager are dismissing the paper. They argue that the returns to schooling should be plotted in logs, and that a lognormal distribution would look very similar to the distribution of the yellow bars that Clark and Neilson found, meaning there is no publication bias. As Smith argues:
When do you use log returns? When there’s some lower bound on your returns. It’s incredibly unlikely that any researcher would ever find that an additional year of education causes kids to make 25% less money when they grow up.
It’s easy to get caught up in the math, but essentially, their argument boils down to this: they don’t believe there are missing negative return results because they assume that returns can’t be negative. This is undoubtedly an efficient method of argumentation—just assume that findings you disagree with can’t exist a priori. But no one else should find this method of argumentation persuasive.
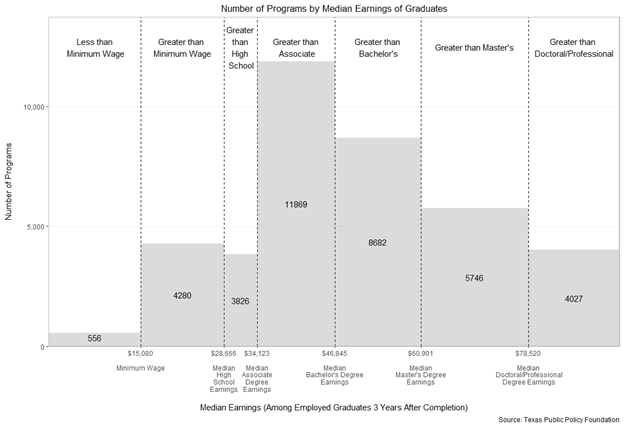
In particular, the assumption that returns can’t be negative is easily disproved. Below is a chart that documents the median earnings for all college programs with earnings data—a program is a college, credential, and academic field combination, such as a bachelor’s in nursing from Texas A&M. It clearly shows that there are thousands of college programs where graduates earn less than the median high school graduate wage, meaning that the return for thousands of college programs is negative even before taking the cost of attending college into account.
 So, is there publication bias in the returns to education literature? I don’t know. Clark and Neilson present some convincing evidence there is, but they could be wrong. But assuming returns can’t be negative, as Smith and Meager do, is inaccurate.
Photo by ra2 studio — Adobe Stock — Asset ID#: 474112024
What is never factored into any of this is the basic concept of inflation — as the number of potential employees with college degrees increase, the value of each individual degree decreases.
The person retiring now at age 65 would have graduated from college in 1981. A 10 year cohort goes back to those who would have graduated from college in 1971 and a 25 year cohort goes back to those who would have graduated in 1956.
And then remember that it isn’t just the 22-year old college grad but the 62-year-old person without one and hence not just the actual number of people graduating from college in 1956, 1971, 1981, or 2023 but also the percentage of the entire workforce with college degrees.
So you then are looking at how many people obtained college degrees in 1916, 1931, 1941, and 1983 — I’m trying to keep the math simple here to make a point about how the percentage of persons in the workforce will increase with the percentage of persons earning a degree each year, but still will lag behind that.
And hence we get something like this: https://www.statista.com/statistics/184272/educational-attainment-of-college-diploma-or-higher-by-gender/
It’s a basic economic concept — scarcity increases value — and the value of a college degree back when only 5% of the population had one is not the same as it is today when 35% of the population has one — and when about half of the 22 year olds have one.
And that’s what needs to be reflected in any study of what a college degree will be worth in 2027…